Skills Insight Report - AI Deployment Dashboard
Overview
Enterprise organizations face increasing pressure to understand the distribution of skills across their workforce, yet many lack a clear, data-driven view into who holds what expertise and where they sit within the org.
The Challenge
Organizations struggled to effectively analyze their workforce's skill sets at a cluster level. While they could search for specific skills in the Skills Insight Report (e.g., "NLP" or "C++"), they lacked the ability to understand broader capability areas. This creates blockers for decisions like internal mobility, reskilling, and hiring. Leaders needed a way to answer questions like "Who in my organization has data analytics skills?" without manually aggregating multiple related skills.
Meet the Team
-

Justin Nathaniel
Lead Designer
-

Stacey Fang
Senior Program Manager
-

Martina Dove PHD
Senior UX Researcher
Solution
Over a 3-month period, we designed an AI-powered experience to help analysts search for specific skills and narrow down insights via the Skills Insight dashboard, surfacing inferred skill holders across the organization based on workplace data signals.
Key Assumption
Using AI-inferred skill signals from workplace data would give analysts a more holistic and reliable view of skill distribution than traditional, manually reported methods.

User Research Insights
We conducted 8 interviews with internal and external stakeholders, delegates, and analysts to uncover needs and pain points.
Through our stakeholder interviews, we uncovered several key insights:

— User Testing Participant
"We really wanted to learn about what specific data analytical skills our employees were good at. Things like data visualization and data analysis and understanding what steps people have taken, concrete steps to become proficient in those areas."
— M2+ Leader, Microsoft
"I want to see things such as front-end skills vs. back-end skills; data processing skills; data ingestion skills. And drill down from there."
Problem Space
Manual Skill Aggregation
Users had to manually add individual skills to perform cluster analysis
Process was labor-intensive and prone to errors
No standardized way to group related skill
Limited Visibility
Difficult to understand organization-wide capabilities
No clear way to identify skill gaps
Challenges in workforce planning


The Solution
Designed an intuitive interface that enables users to:
Search and select skill clusters (e.g., data analytics)
Automatically include relevant subskills and related skills
Customize skill groupings based on organizational needs
Visualize skill distribution across the organization
Track skill trends over time
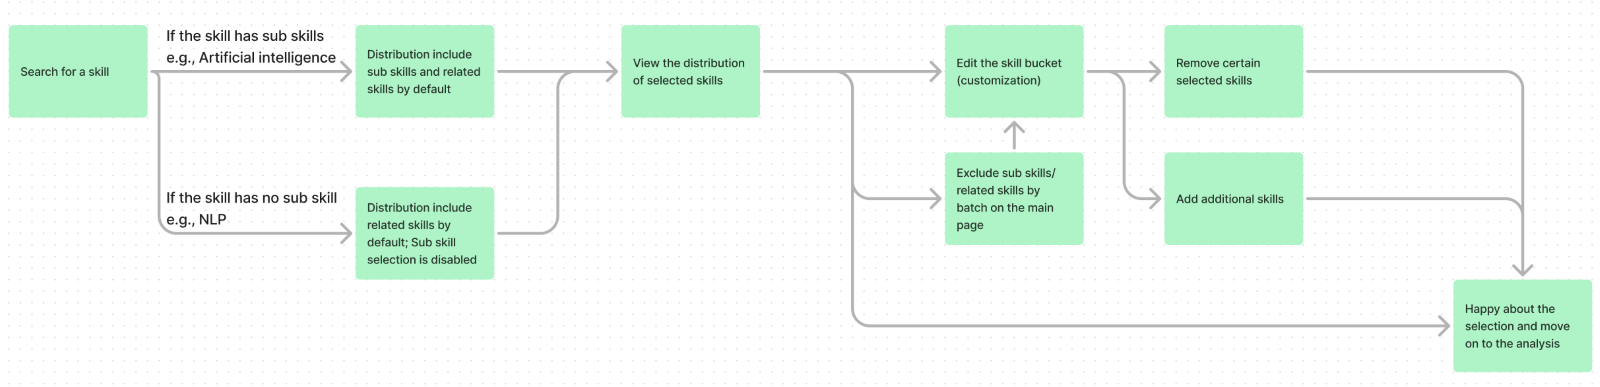
Task flow
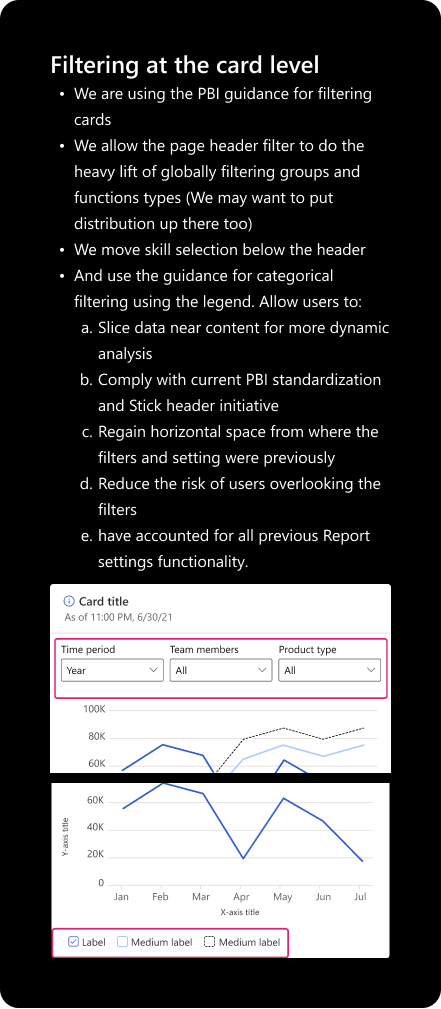
One of the most critical moments in the experience was enabling analysts to search for a skill and customize the results to reflect their exact analysis needs. The team focused on building flexibility into this workflow, so users could trust that what they were seeing was relevant, nuanced, and tailored to their decision-making process.
Here’s a breakdown of the primary task flow:
Search for a Skill
The journey begins when an analyst enters a skill (e.g., Artificial Intelligence or Natural Language Processing).Skill Hierarchy Handling
If the skill has sub-skills (e.g., Artificial Intelligence), the system automatically includes both sub-skills and related skills in the distribution view.
If the skill has no sub-skills (e.g., NLP), the system includes only related skills and disables sub-skill selection.
View Distribution
The analyst views a preliminary distribution of skill holders, allowing them to see the data surfaced from AI inference.Skill Bucket Customization
From here, users can refine their selection:Exclude sub-skills or related skills in batches directly from the results page.
Enter a dedicated customization mode to fine-tune their "skill bucket."
Skill Bucket Editing
Analysts can:Remove specific skills that don’t match their intent
Add additional skills that better capture the role or capability they’re investigating
Finalize Selection
Once satisfied with their tailored skill set, users proceed to analysis — confident that the data reflects the precise capabilities they’re interested in exploring.
Initial Concept
At this point we felt like we had a good handle on the flow and core user needs based on our hypothesis. So I sketched out some concepts to pitch to the Senior Leadership Team during a design review.
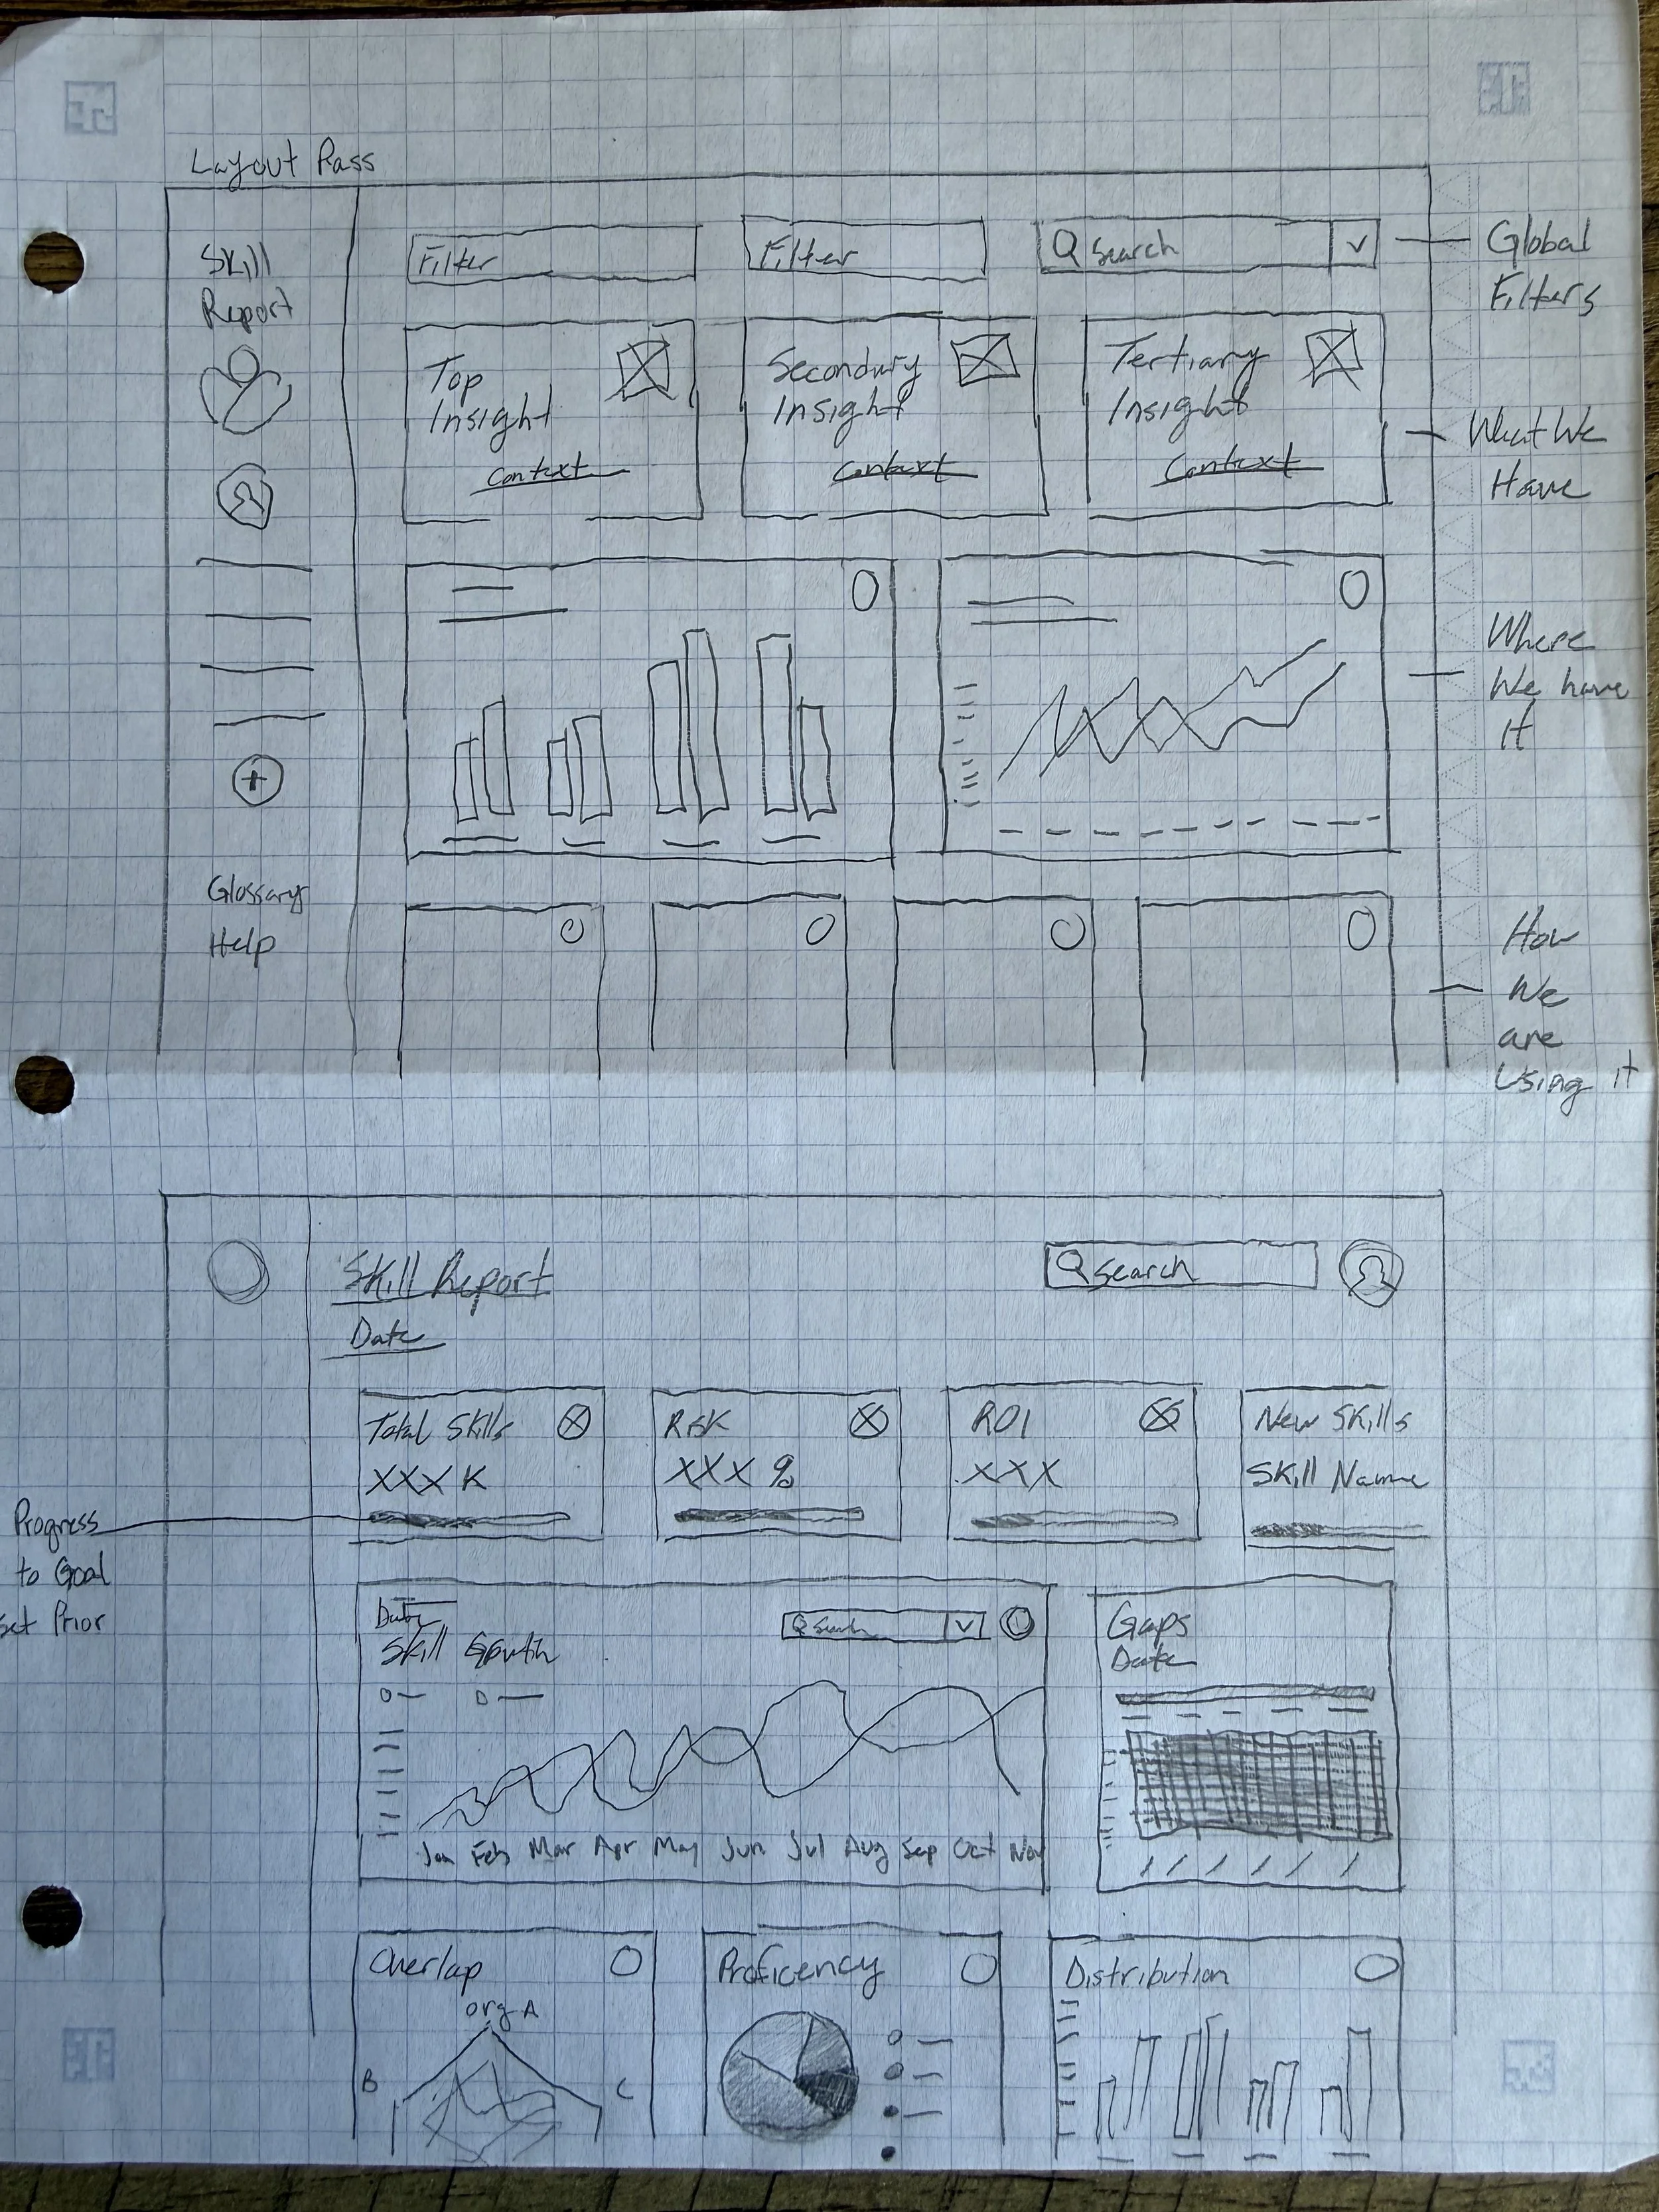
After sketching I mocked an amalgam of the concepts into a design with a fair bit of polish. The intent was to gain buy-in from the stakeholders by giving them something more substantial to view that would preemptively answer some of the questions they were sure to have. In an effort to expedite a green light.


A Major Pivot
This design garnered a lot of attention and was taken under consideration to move forward. But after input from our engineering partners. Stake holders wondered what a concept would be if we didn’t build a new system and instead leveraged our 15+ year old Power BI system instead. It was a big blow to the trajectory and the overall look and feel of the product. But, I was in charge of maintaining the PBI for Viva Insights design system so it made it easier to make the necessary changes.
High-Fidelity Design & Iteration
Due to the need for frequent internal reviews and quick stakeholder alignment, we chose to bypass traditional low- and mid-fidelity wireframing because PBI for Viva Insights already has a well established system on how reports could be generated. Instead, we leaned into high-fidelity concepts early in the design process to:
Make the concept visually tangible for non-design stakeholders
Drive early buy-in by showcasing realistic interface behavior using AI
Reduce misinterpretation and accelerate feedback loops
This approach allowed us to maintain momentum, refine direction quickly, and stay tightly aligned with evolving business needs and shortening timelines.

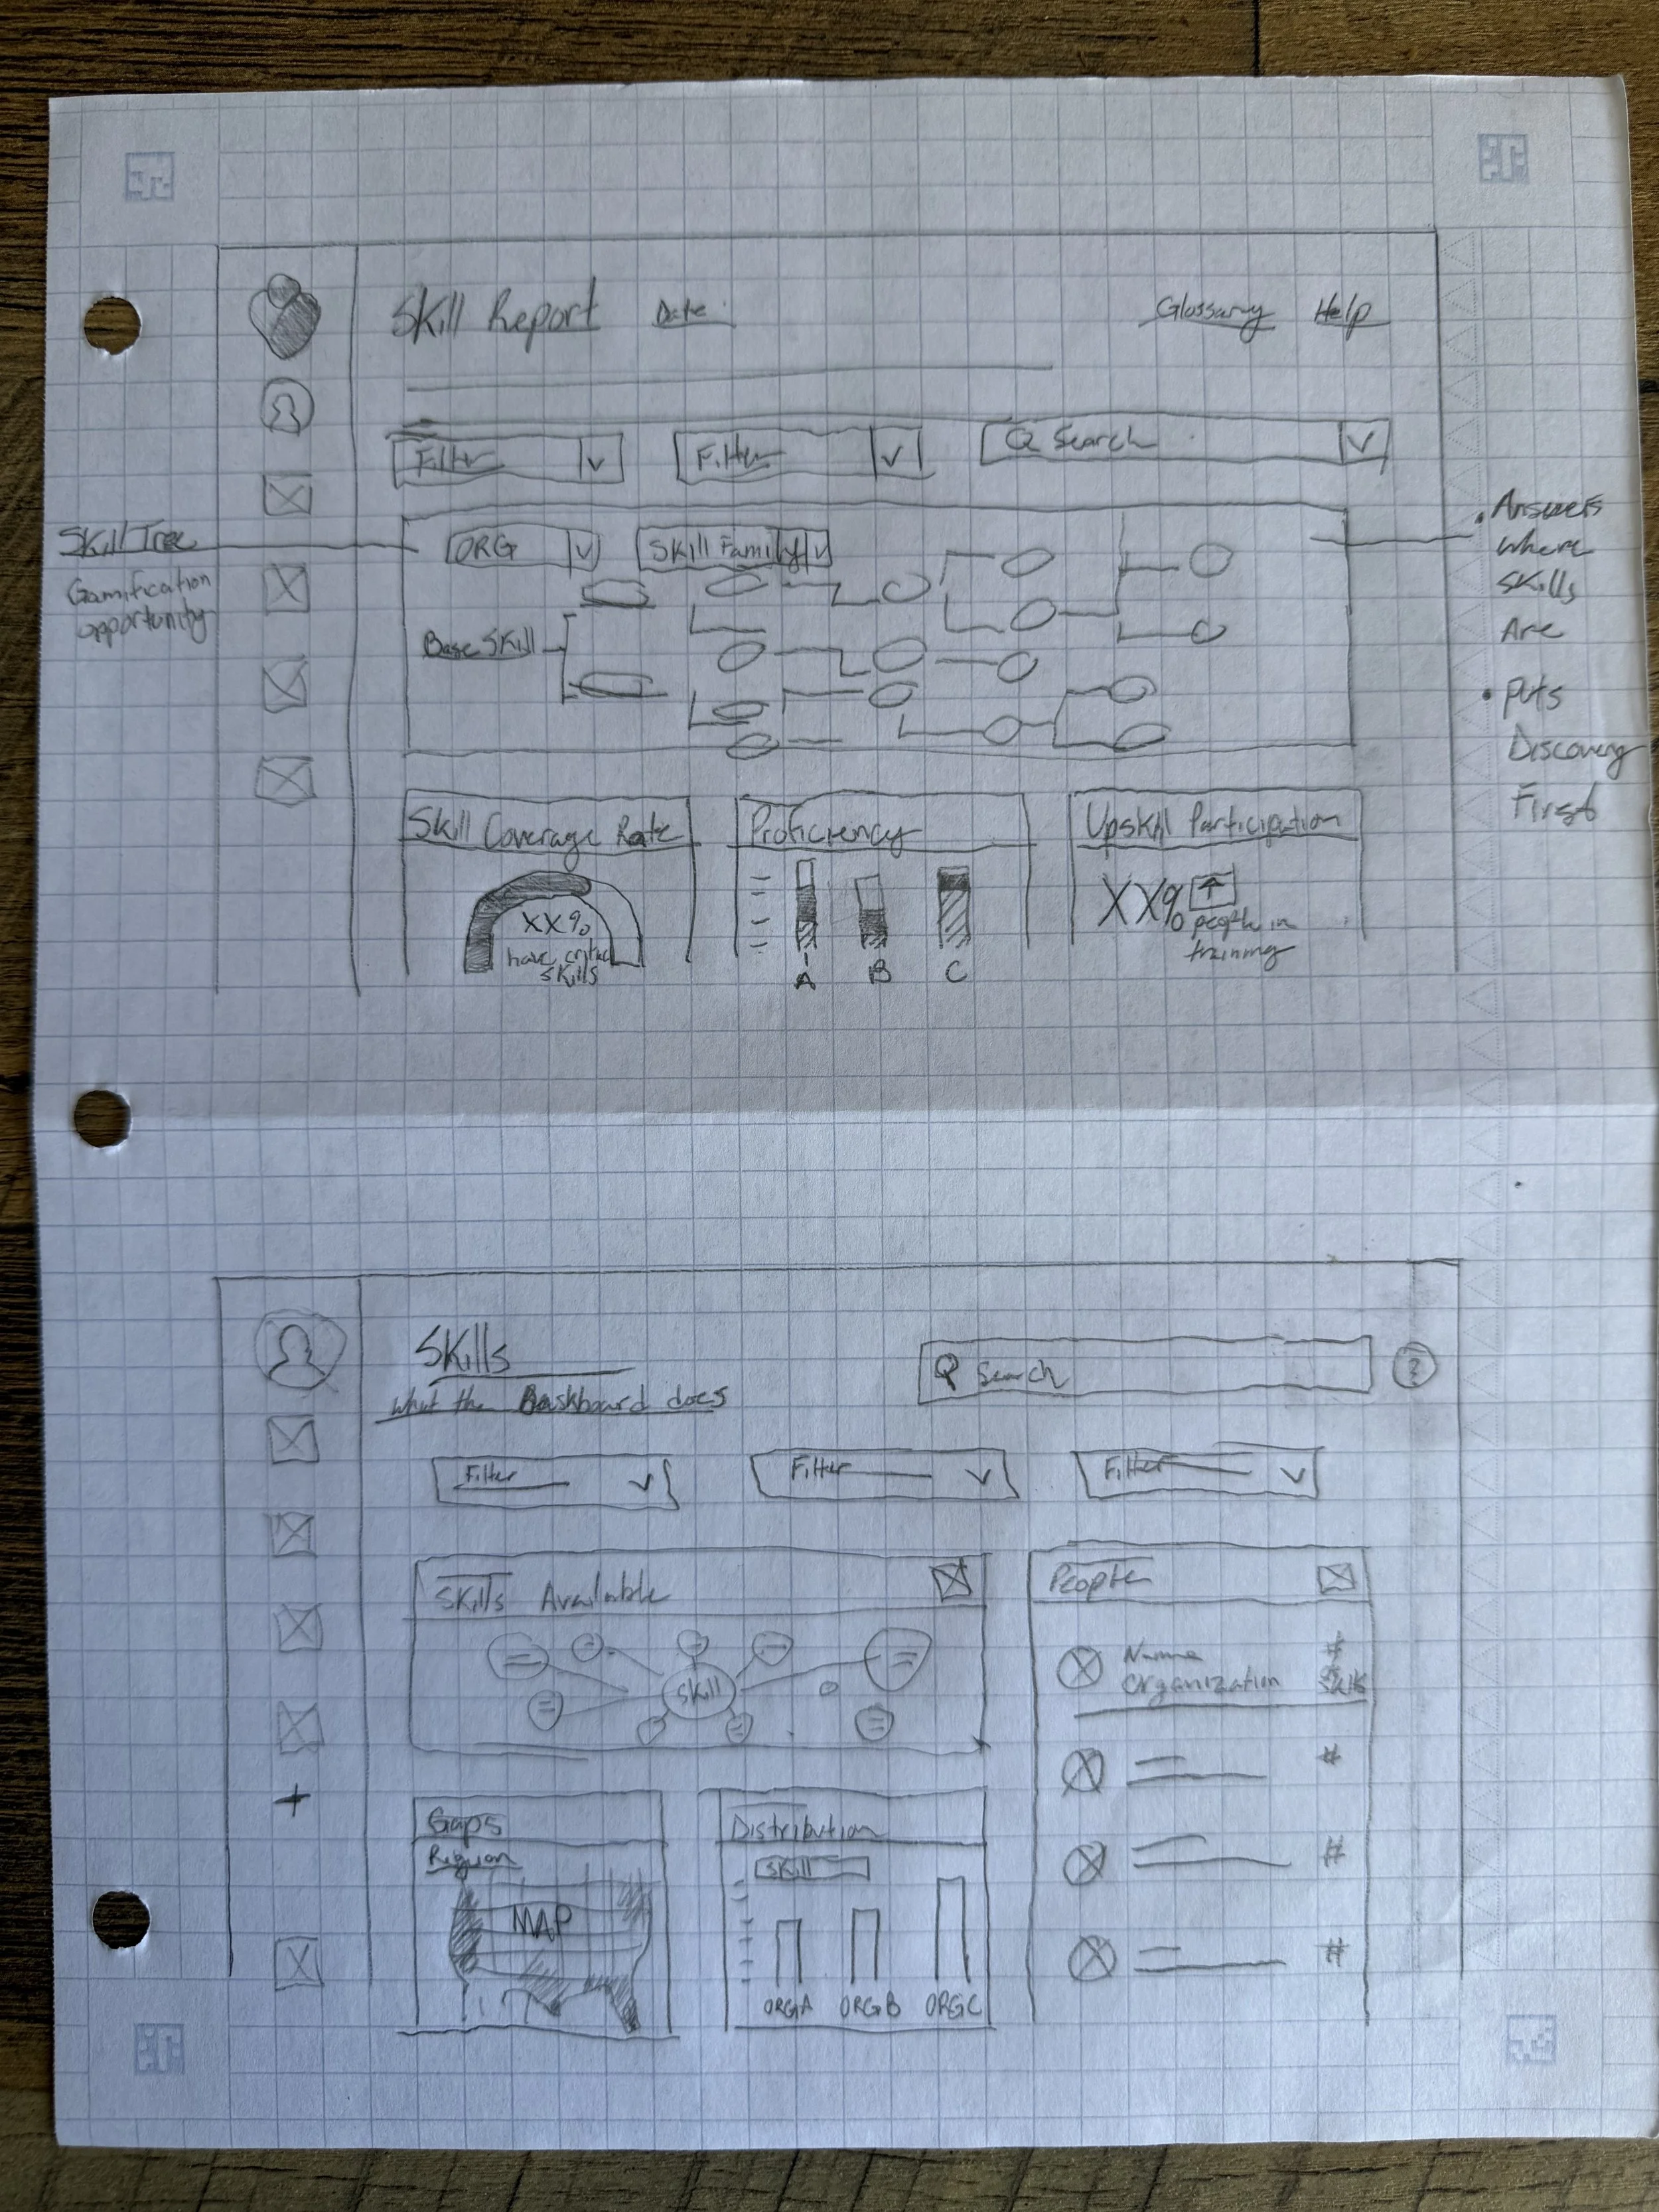
Key Screens
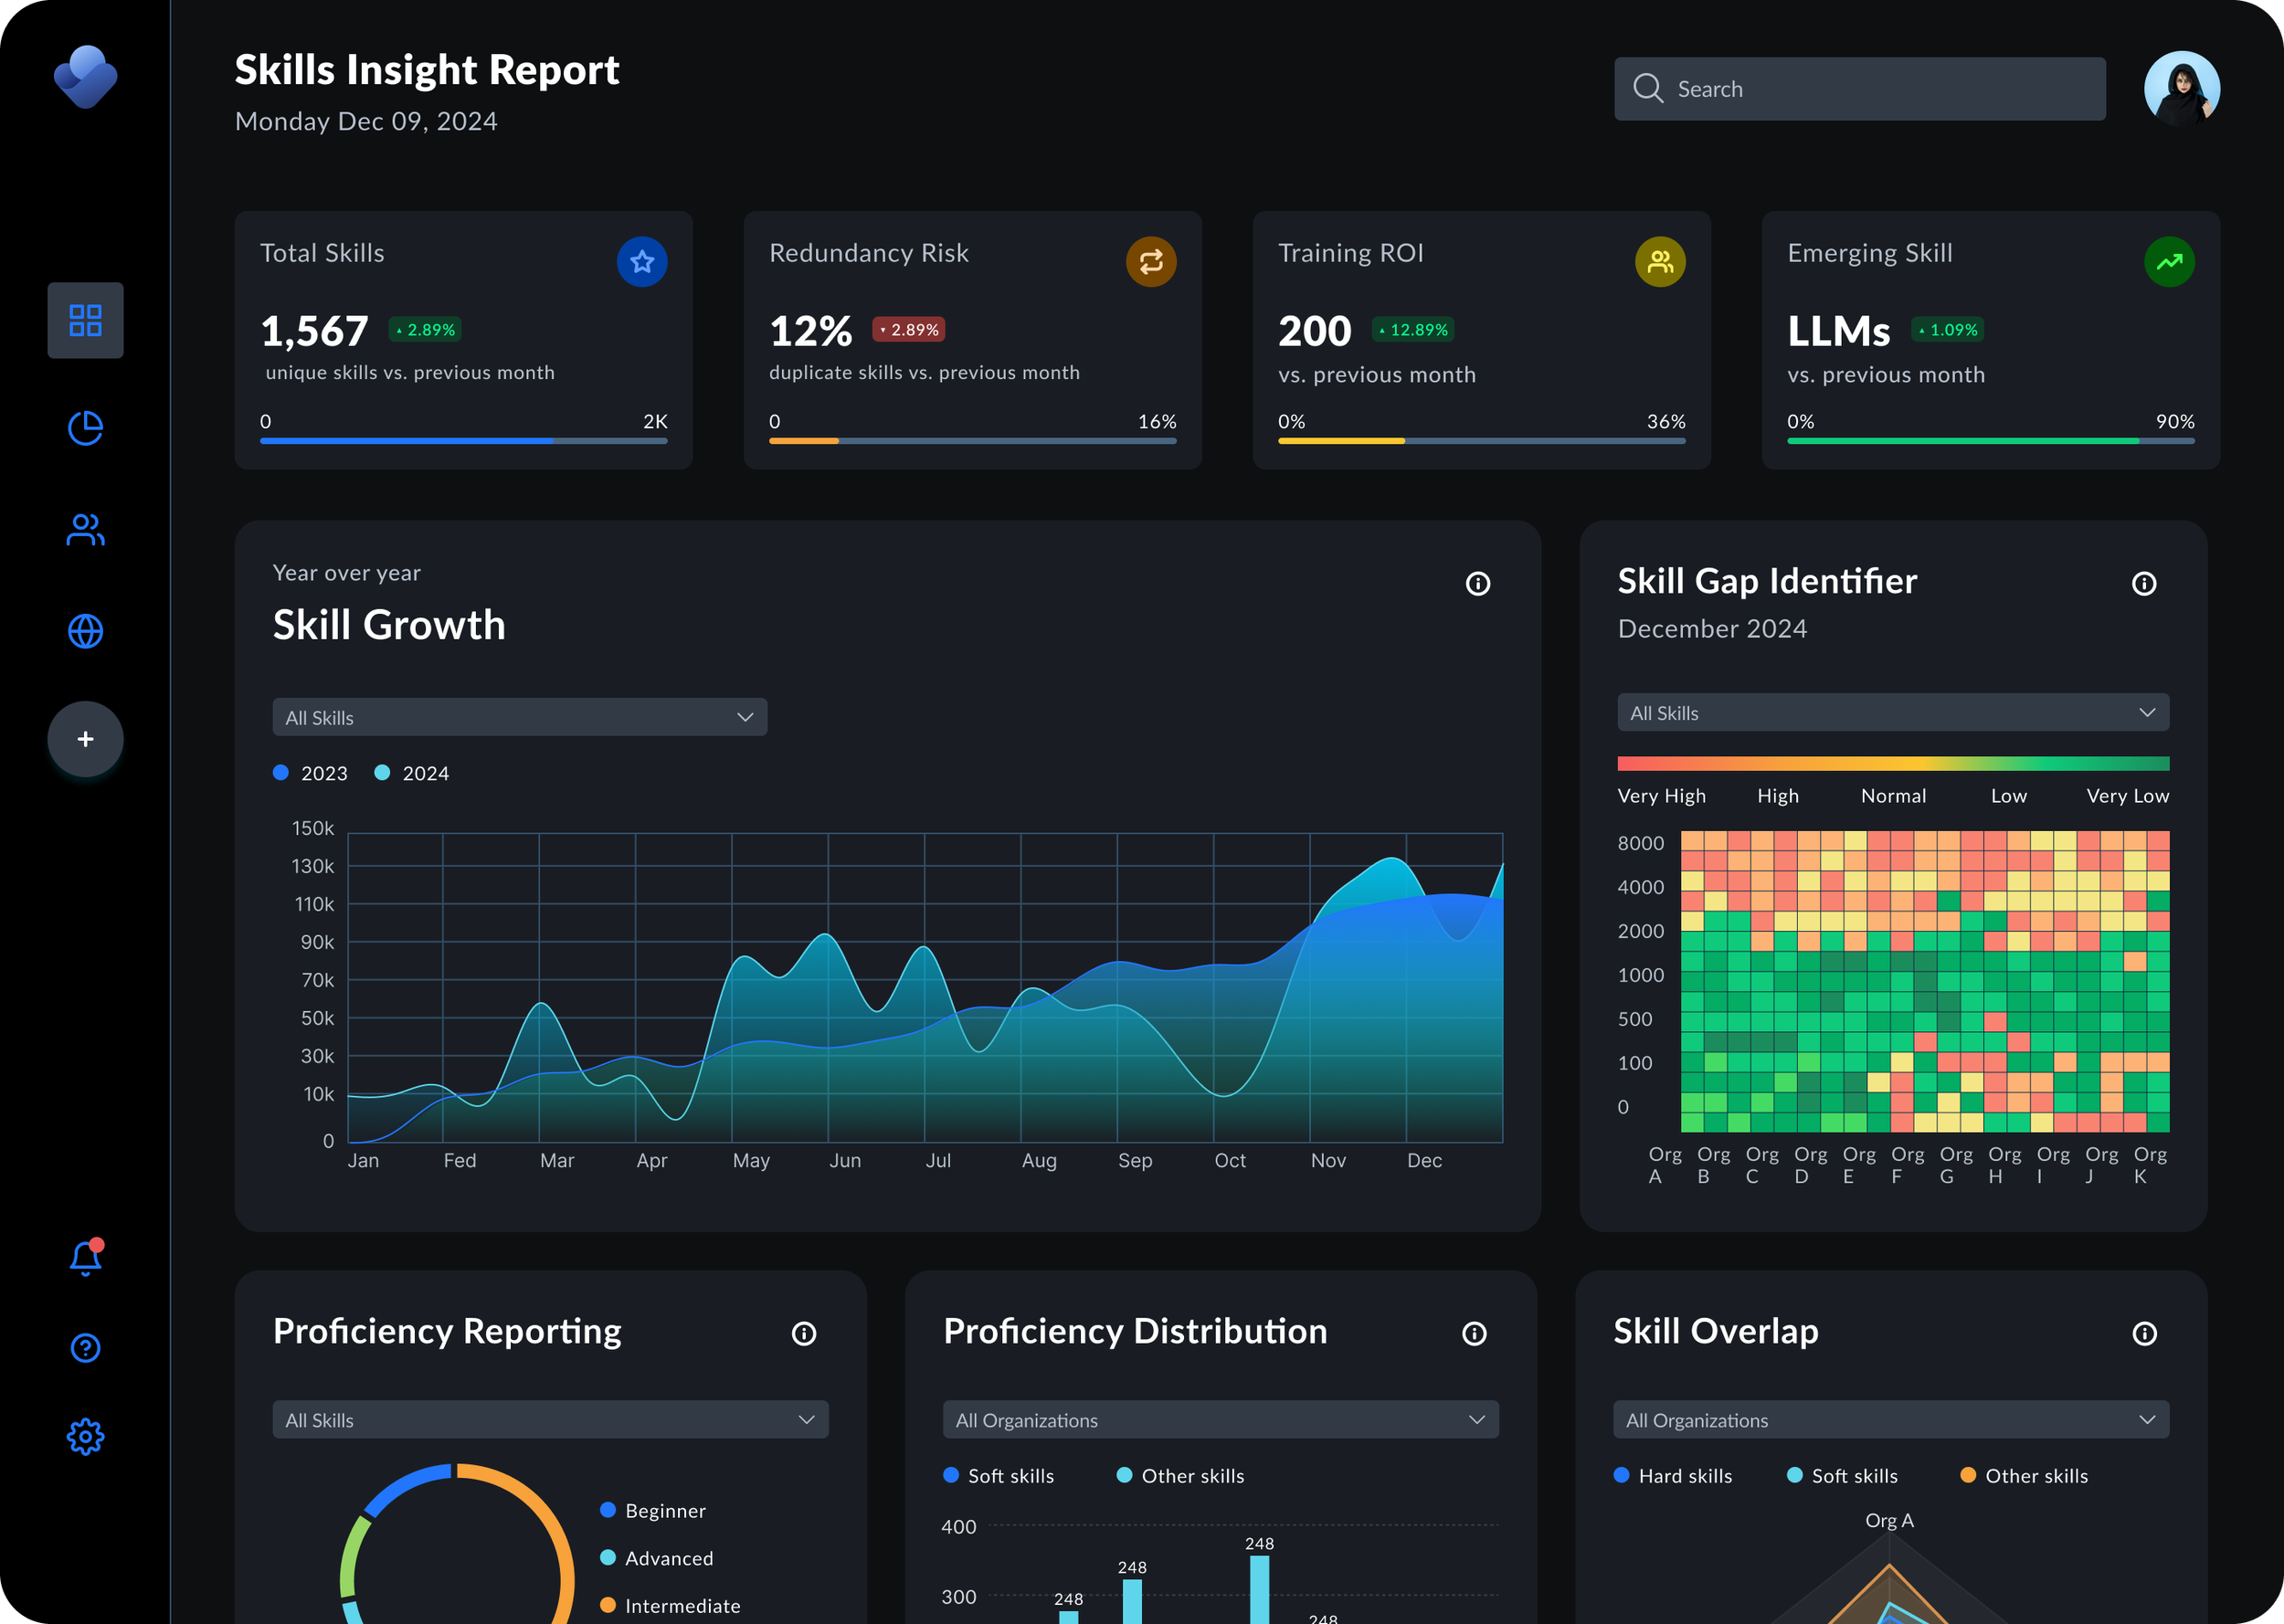
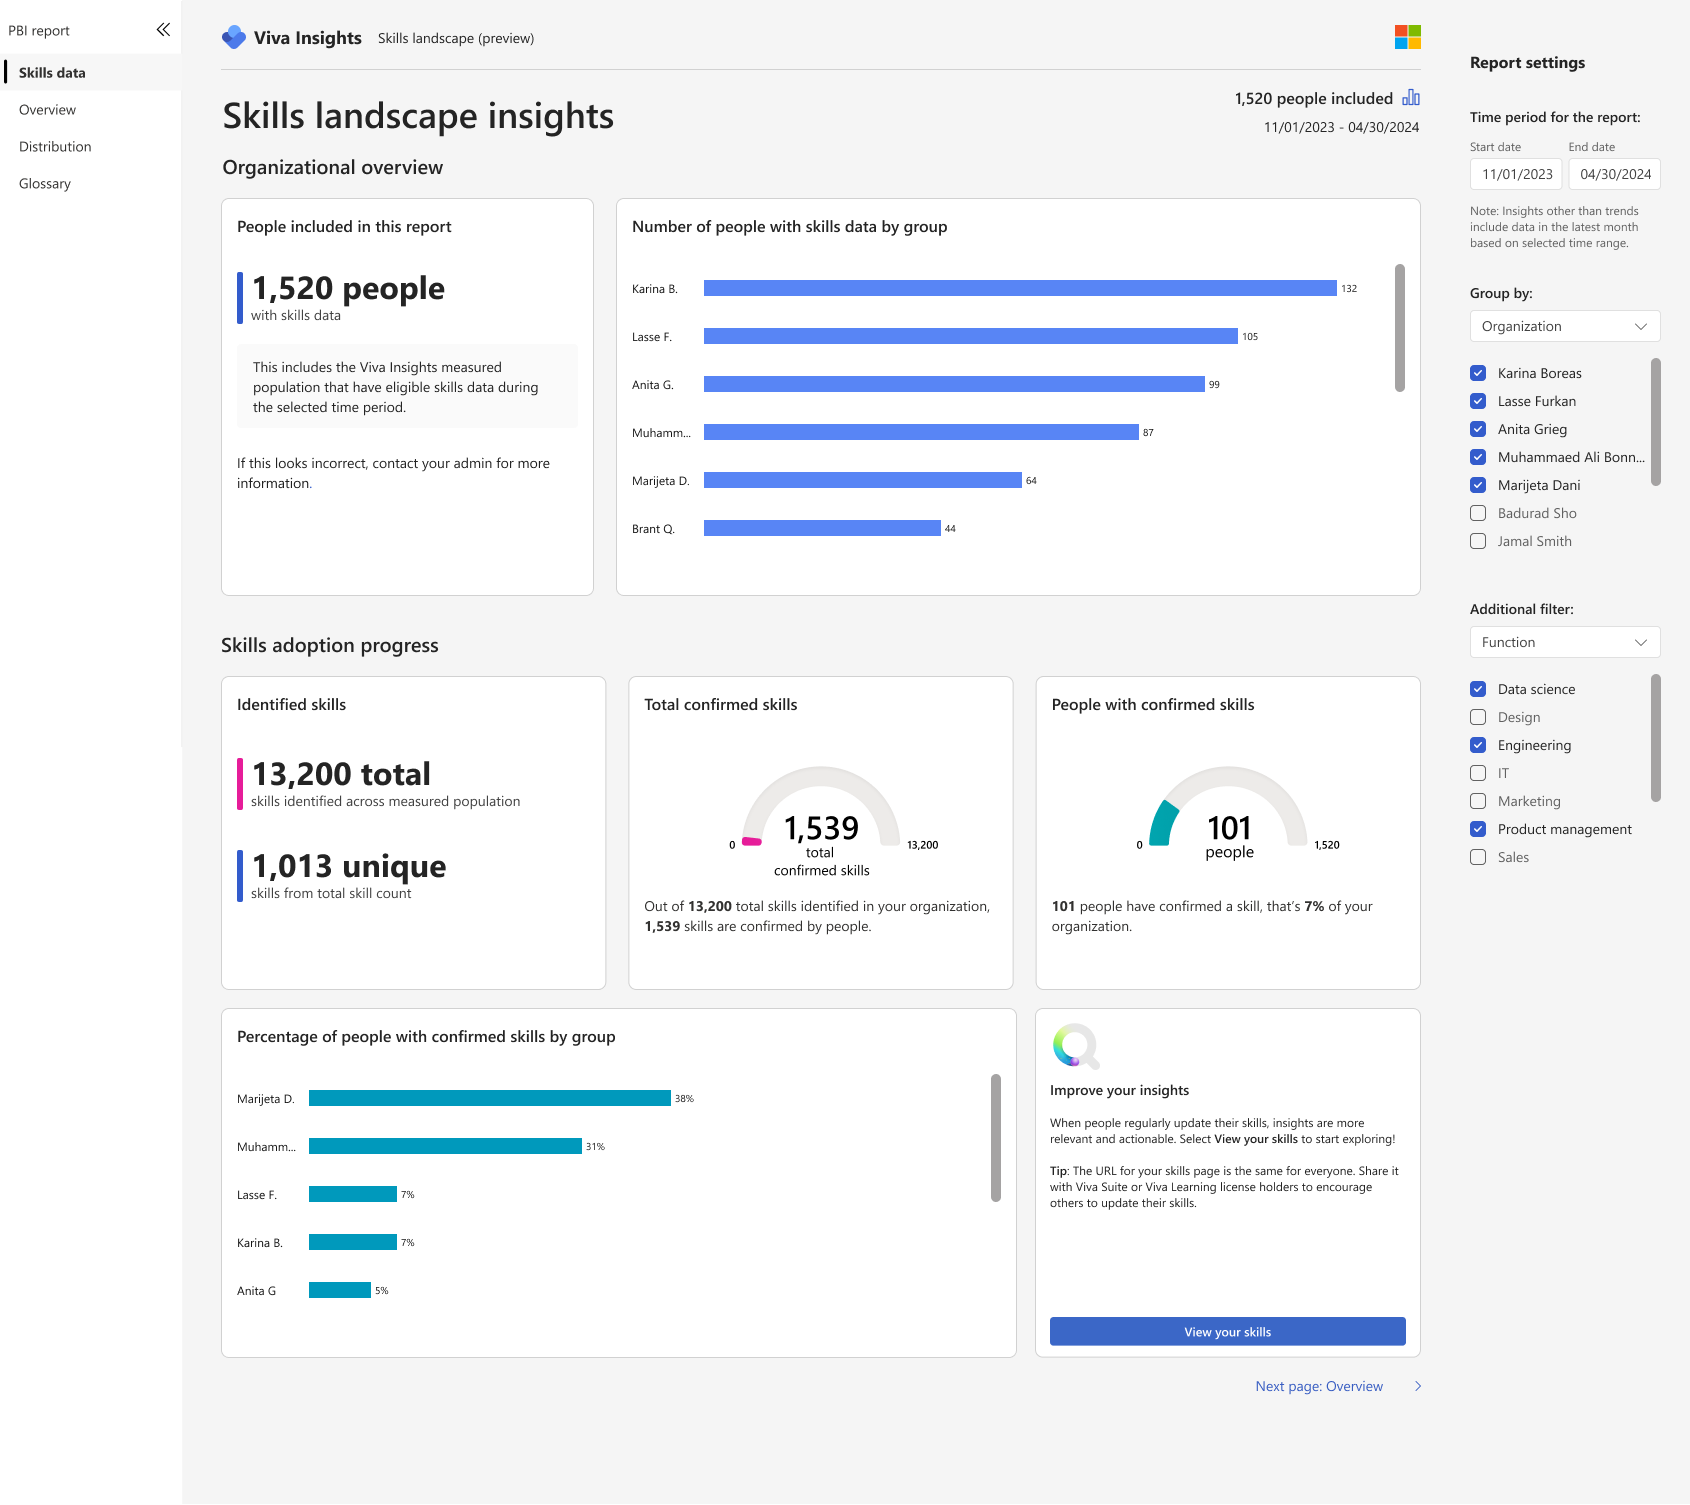
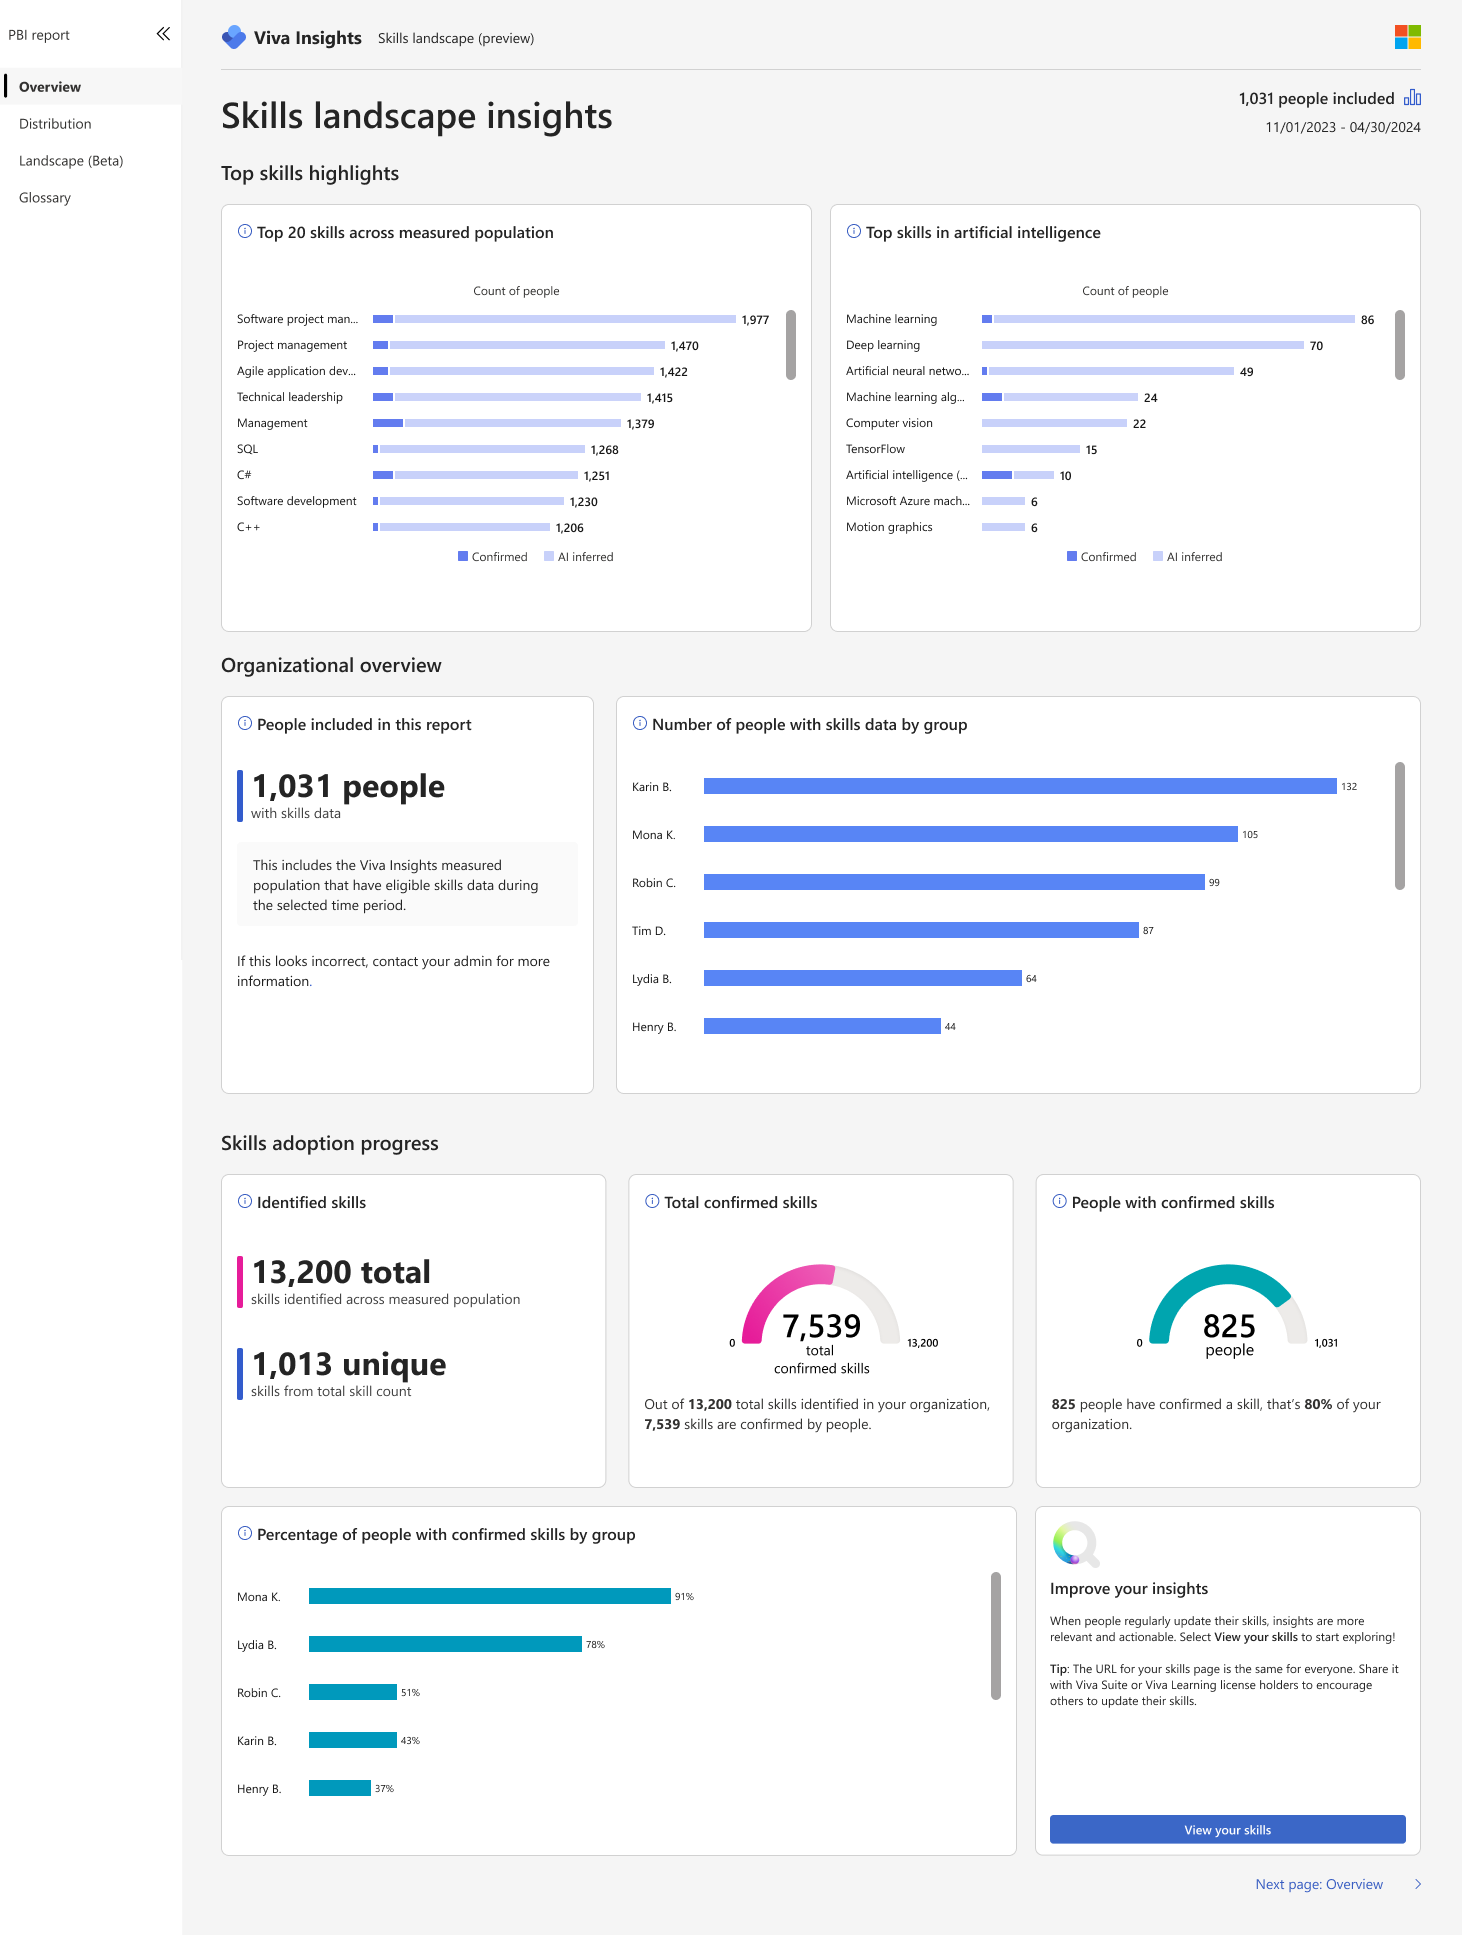
Skills Landscape Insights (Organizational Overview)
This wireframe provides a high-level overview of:
The number of people with skill data
Breakdown of confirmed skills across user groups
Total identified skills vs. confirmed skills
A quick view of adoption progress and engagement
Design Highlight:
Each metric is contextualized to support workforce planning — e.g., only 7% of people had confirmed a skill, signaling potential action areas for leadership.
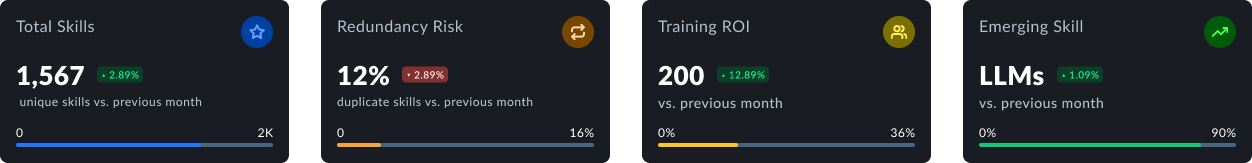
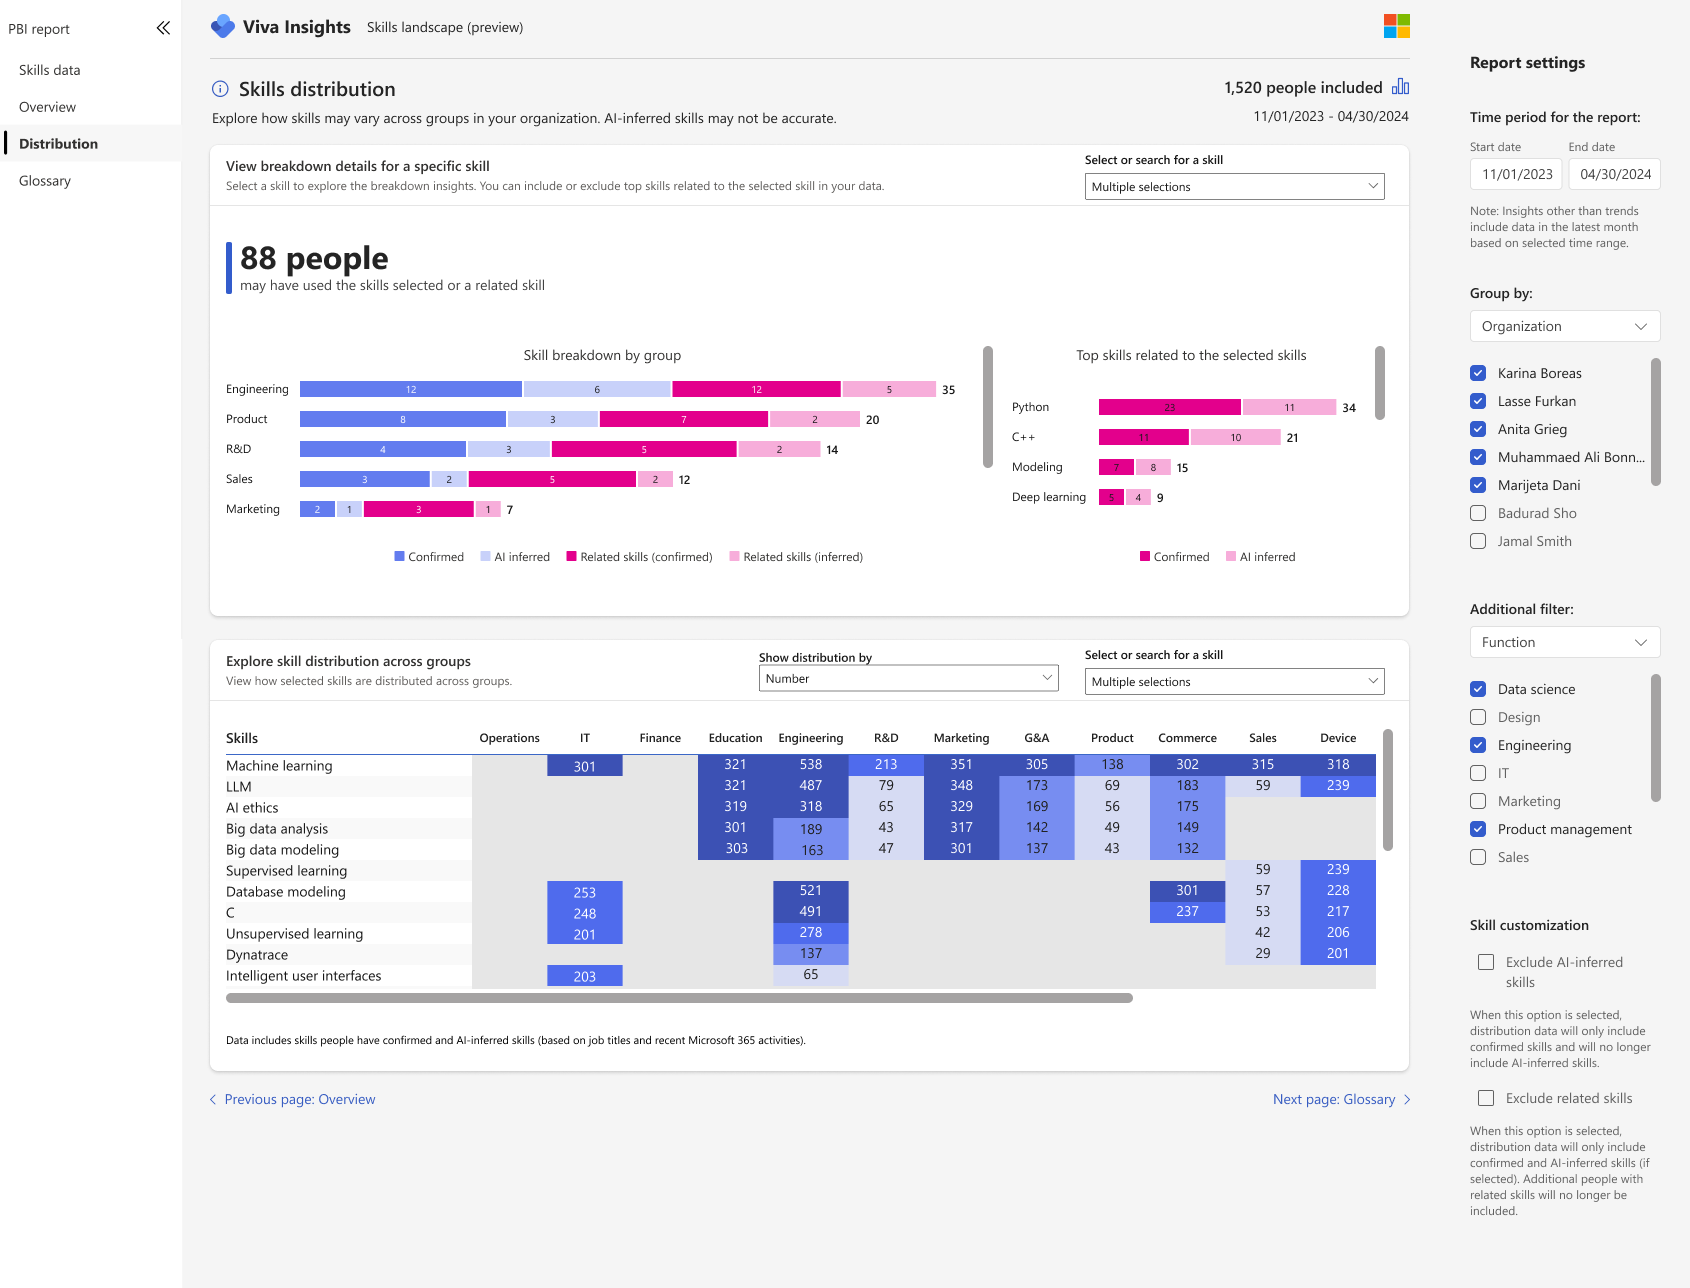
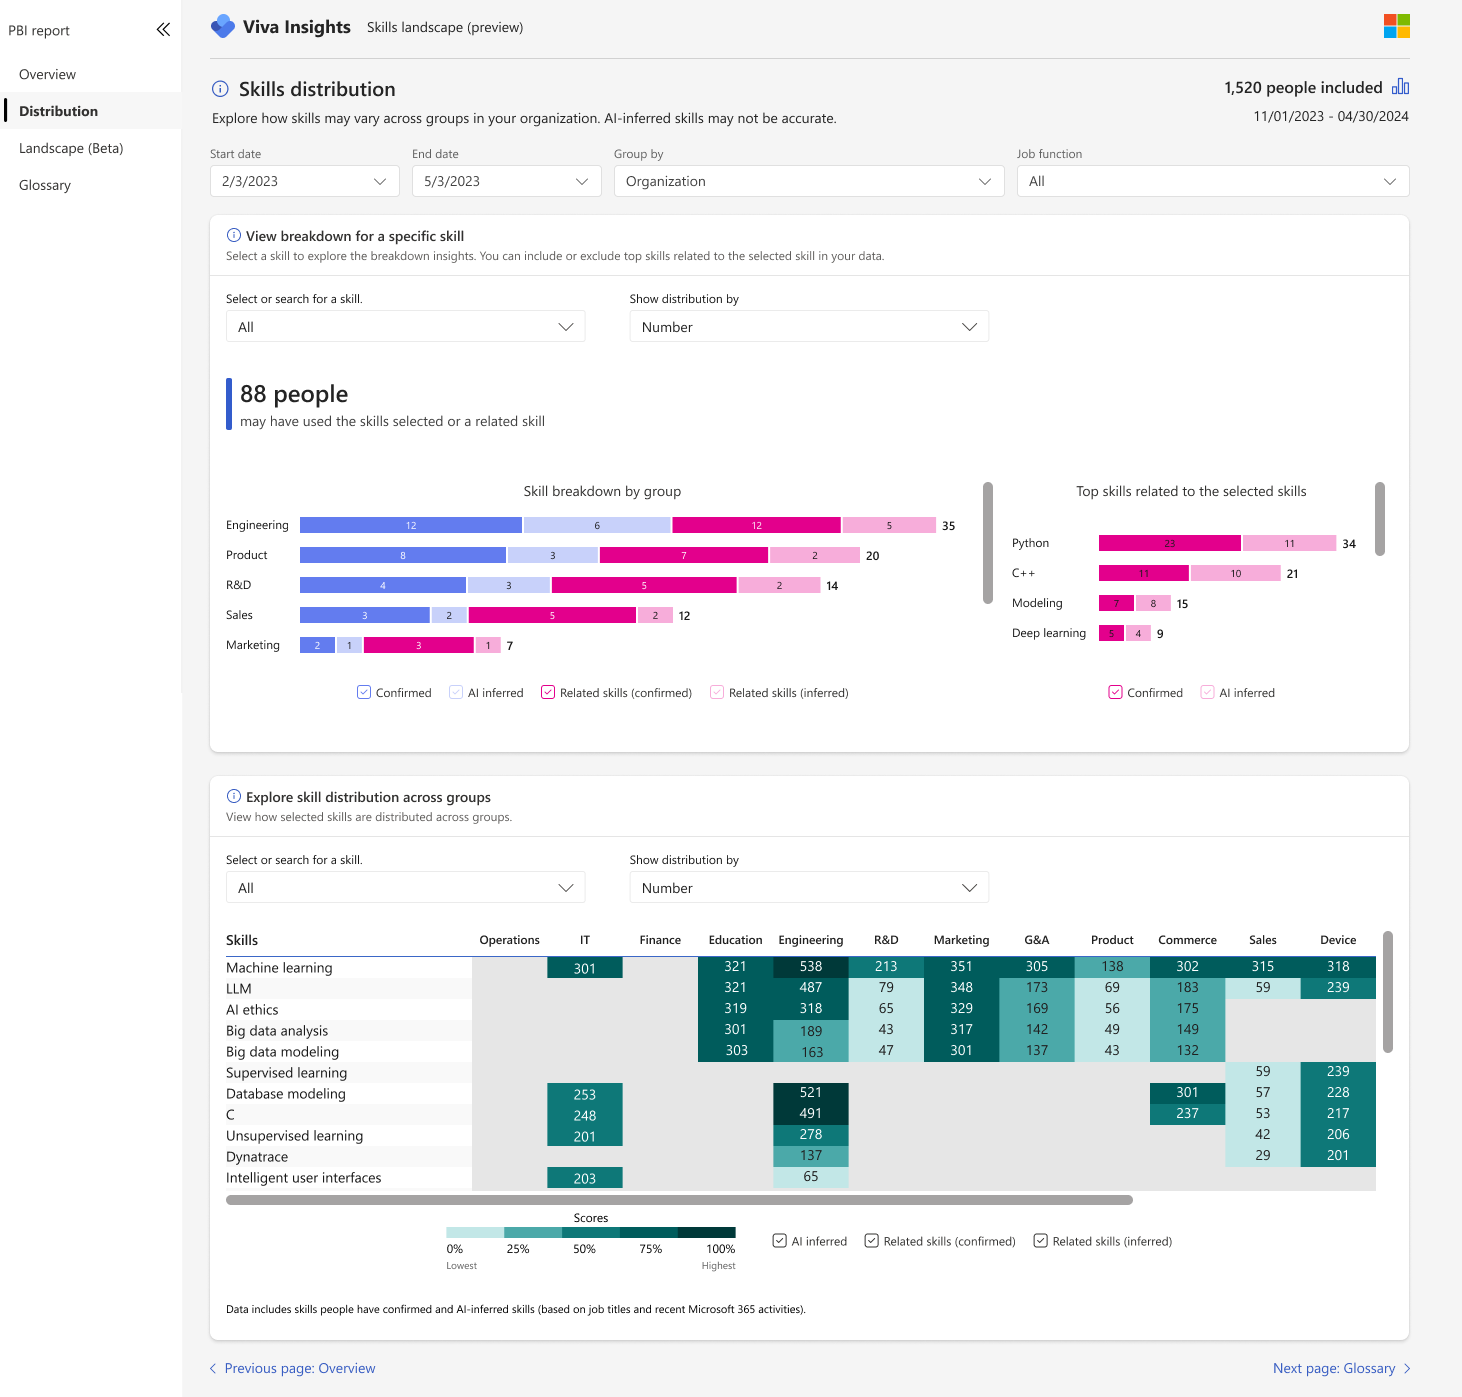
Skills Distribution (Drill-Down by Group)
This wireframe allows analysts and leaders to:
Select or search for a skill (or multiple)
See distribution by department, team, or other filters
View related or inferred skills
Explore how skills map across groups
AI Integration:
Inferred skills (via AI) and confirmed skills are visually distinguished.
Filters allow toggling inclusion of AI-inferred or related skills.
Design Detail:
The lower table allows comparison of skills across org units. For example, analysts can see that Machine Learning is most concentrated in Engineering
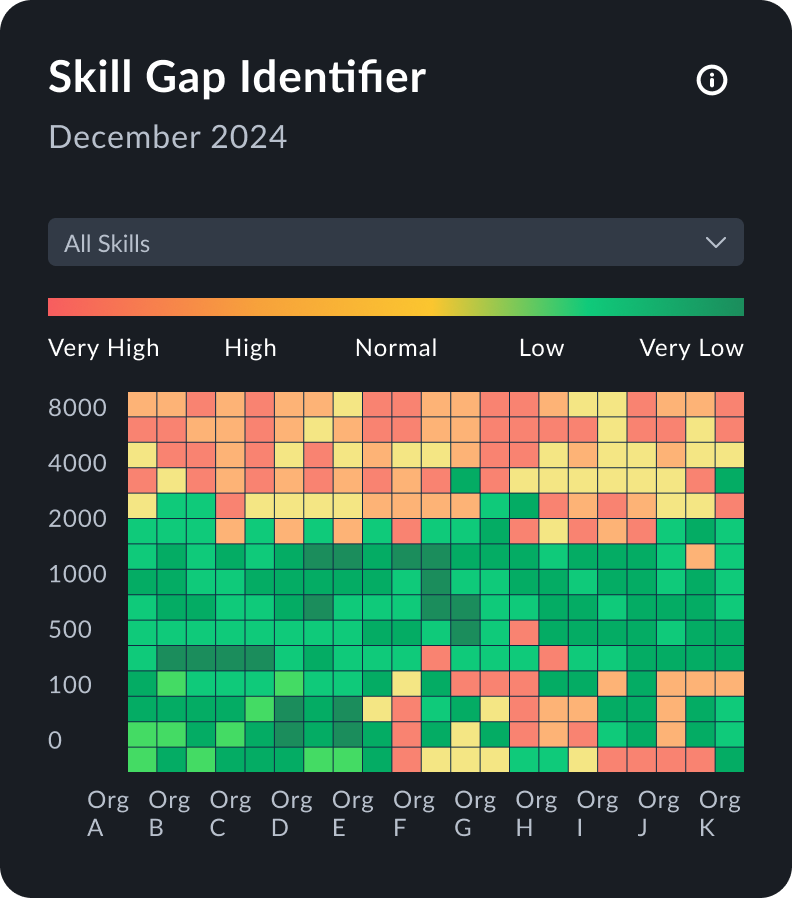
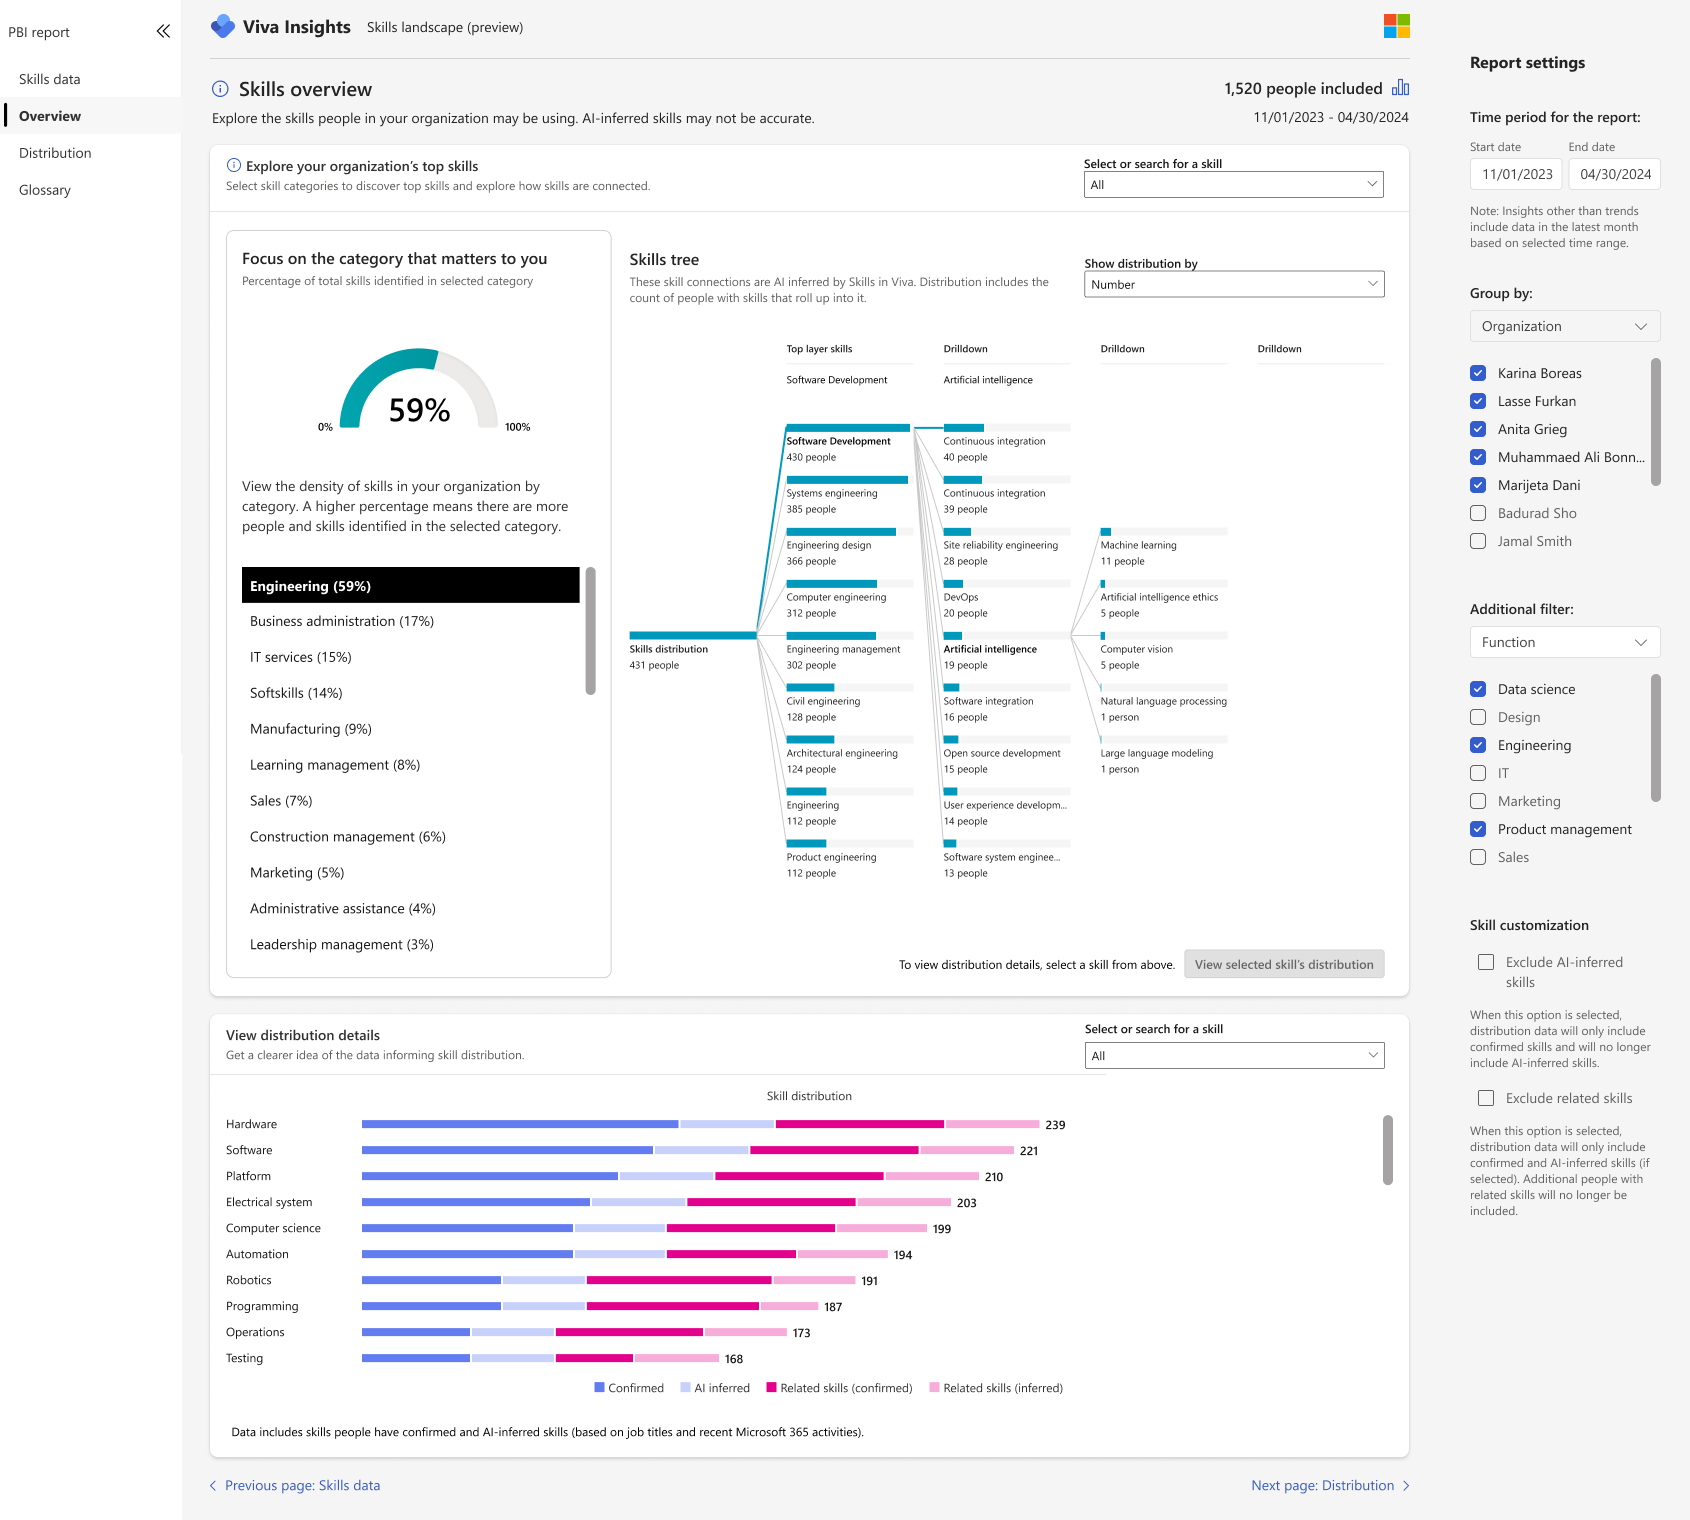
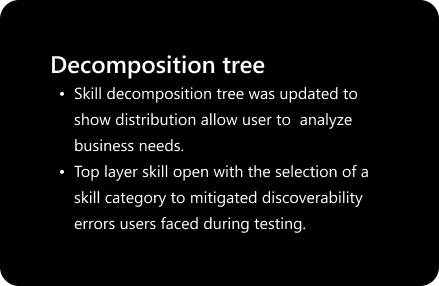
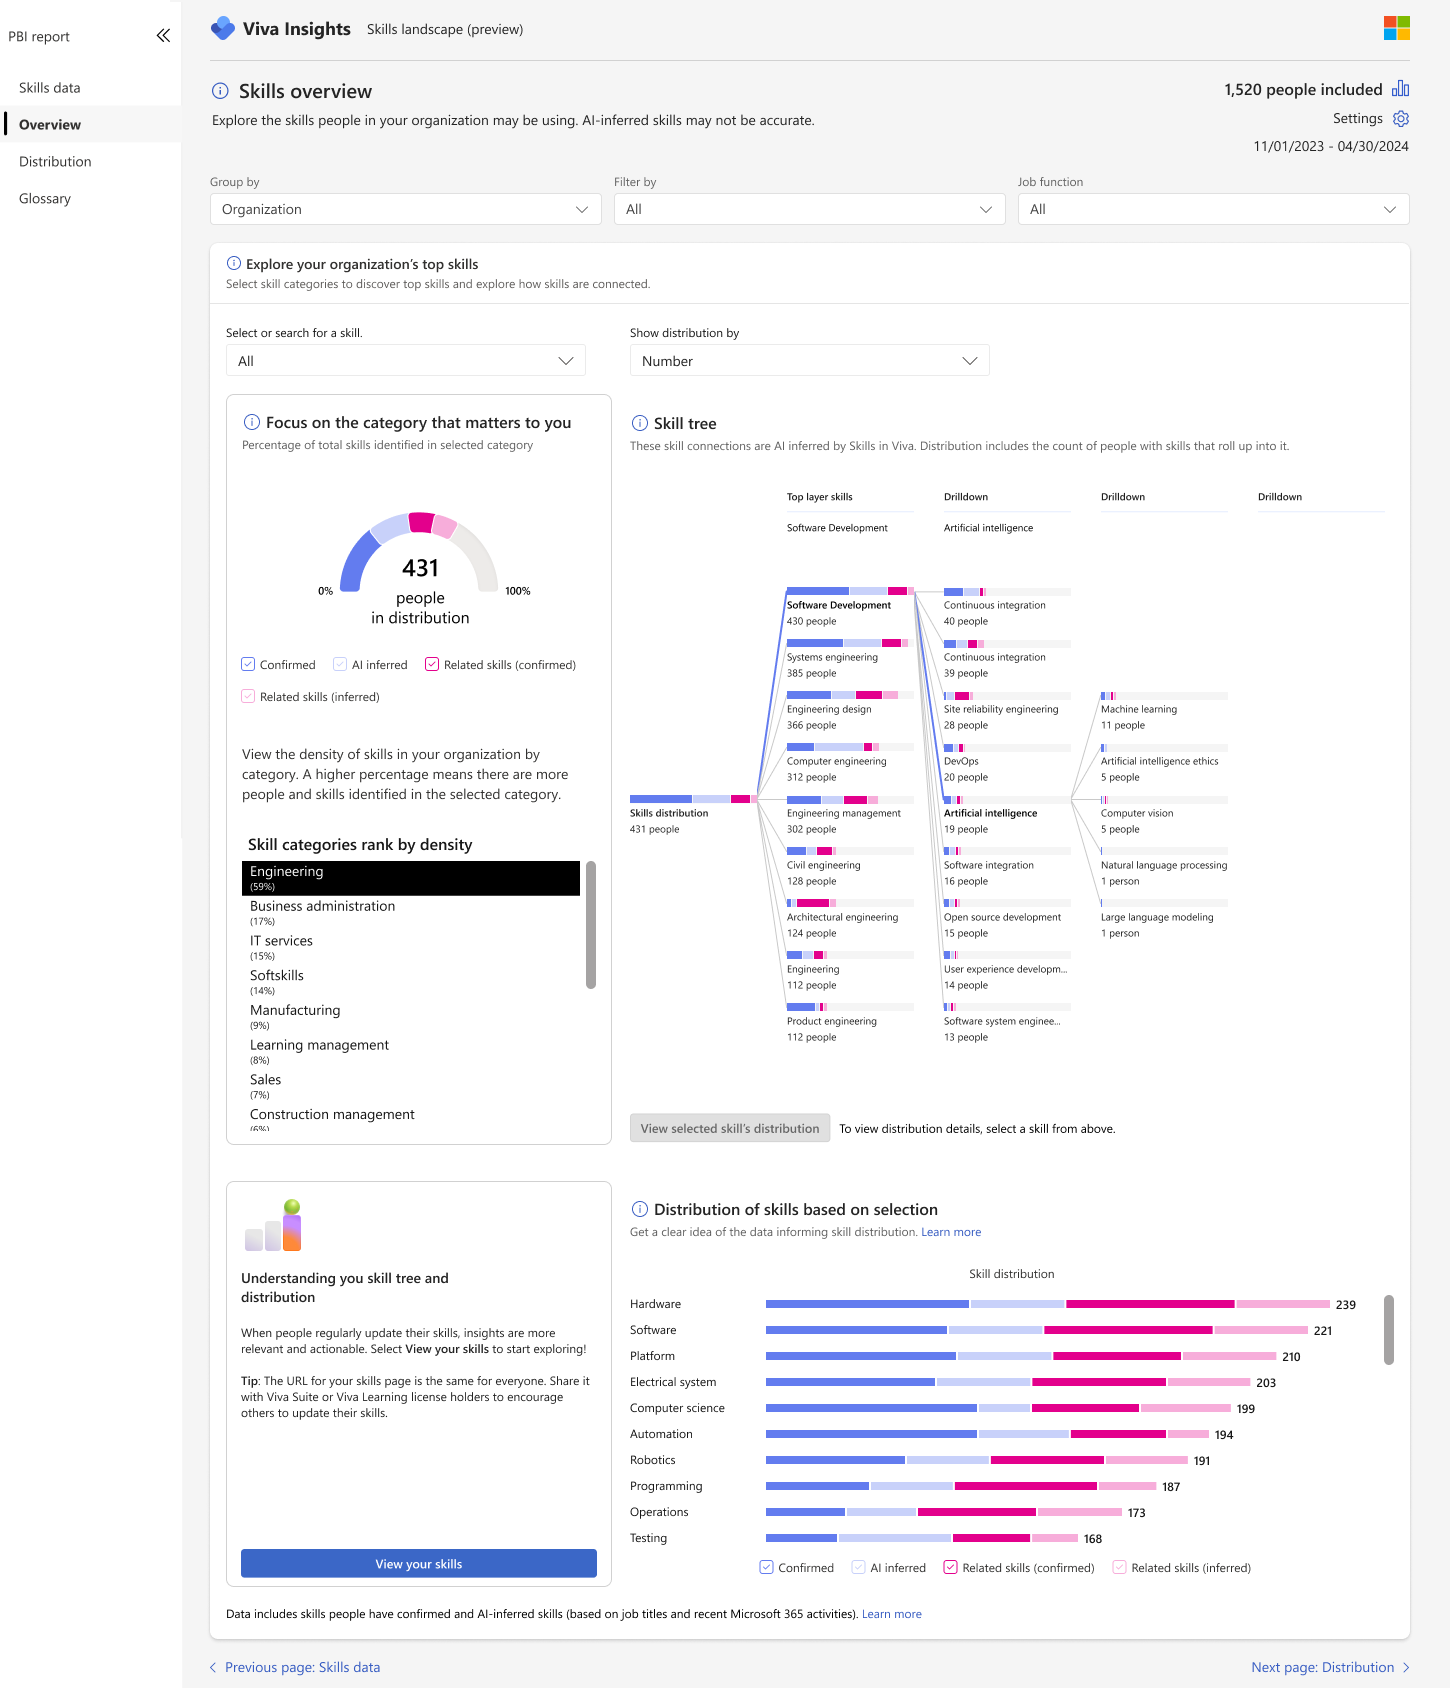
Skills Overview (Tree + Distribution)
This wireframe empowers analyst to:
Identifying top organizational skills by category
Drilling down from broad domains (e.g. Software Development) into specialties (e.g. NLP, AI ethics)
Seeing visual rollups via a “skill tree” that shows how related skills connect
Design Insight: The tree structure helps analysts visualize how knowledge domains nest and overlap — particularly helpful roles where skill boundaries blur or overlap.
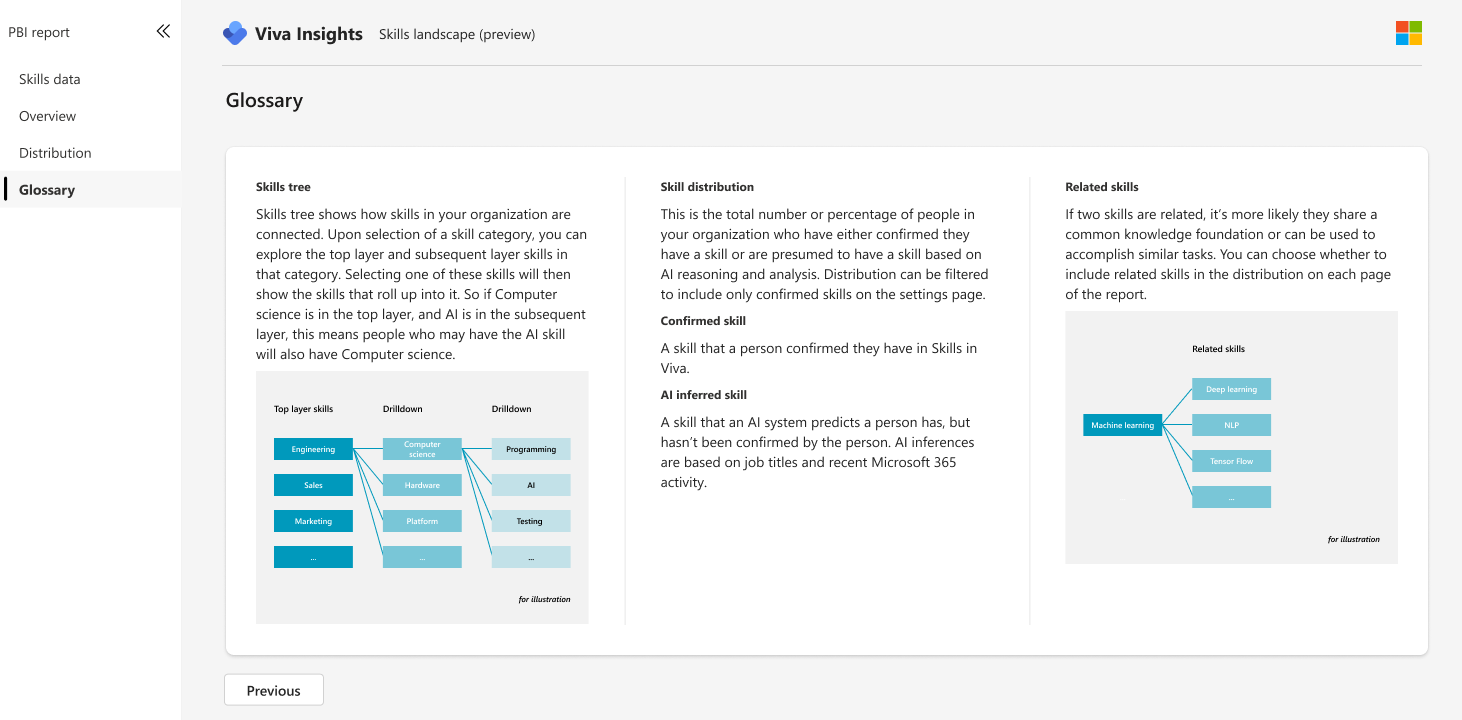
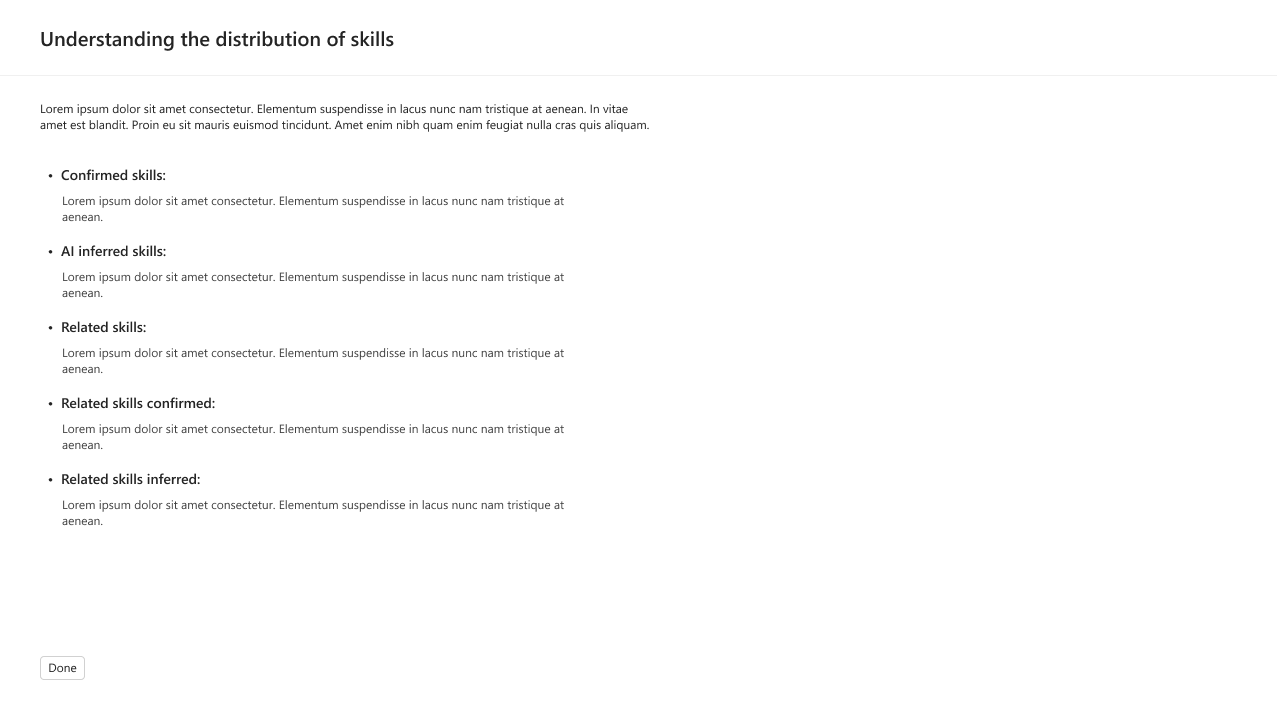
Glossary
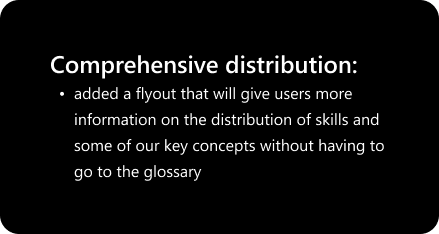
We also added a glossary to reduce the cognitive load on the user by compiling a list of terms that may be new to them or are unique to this product.
Usability Testing & UX Refinement
After developing the initial high-fidelity concepts, we conducted a second round of user testing with 7 new participants. These testers were asked to complete the core task flow, including:
Searching for a skill
Interpreting the skill breakdown and related data
Customizing their skill view
Navigating the end-to-end dashboard experience
We evaluated:
Comprehension of each page’s purpose and capabilities
Task success, including errors or missteps
Sentiment, with qualitative feedback on usability, clarity, and trust
Key Finding: Trust Gap in AI-Generated Data
A critical insight emerged during testing:
Participants didn’t trust the skill distribution visualizations.
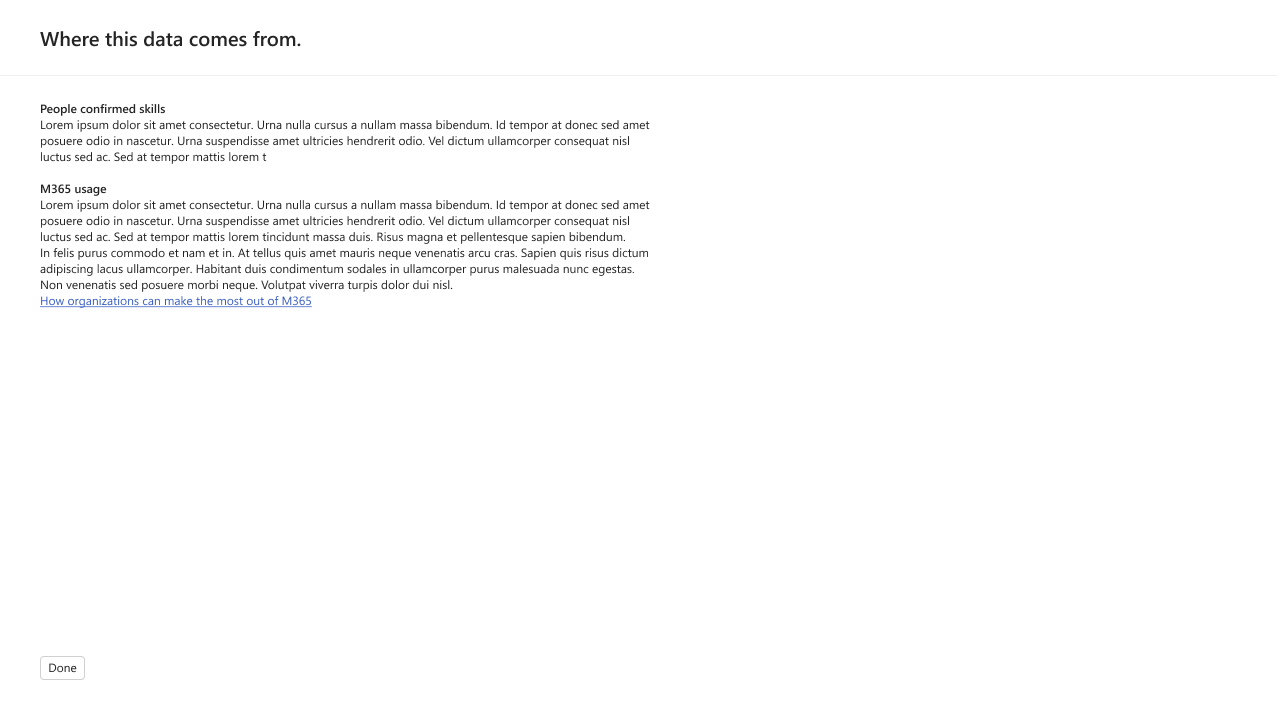
Despite the AI inferences being accurate and well-grounded — derived from signals like job titles, and Microsoft 365 usage — users were skeptical of the data’s validity.
Importantly, the issue wasn’t with the functionality of the dashboard — it was with perception. Users didn’t understand how the insights were generated, leading to doubt about their reliability.
Root Cause: Opaque Inference Logic
We discovered that users lacked:
Awareness of how skills were inferred
Confidence that the system’s logic reflected their lived org experience
Clarity on the difference between confirmed, inferred, and related skills
This highlighted a common challenge in AI design:
Even when models are accurate, lack of transparency erodes user trust.
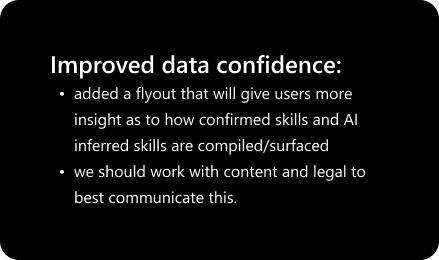
Cross-Team Collaboration: Content + Legal
To address this, we partnered with our Content Design and Legal teams to:
Create human-readable explanations of how AI-inferred skills are generated
Define terms like confirmed, inferred, and related in a clear, digestible way
Introduce these more clear definitions into the dedicated Glossary page and integrate light-touch cues throughout the product
At the same time, we ensured that:
Proprietary inference methods remained legally protected
Brought disclaimers closer to AI usage.
Complied with Microsoft’s Responsible AI Principles
Language struck the right tone between transparency and trust-building
Refined Design
We explored a bit more to determine how best to implement the data we gained from user testing


Copilot Integration
To further enhance usability and bridge the gap between data and decision-making, we partnered with Engineering to integrate Microsoft Copilot directly into the Skills Insights Report experience. Prior to this the PBI file type was not readable by Copilot.
This enabled analysts and leaders to interact with the report using natural language, transforming the traditionally tedious act of viewing and slicing a dashboard into an effortless, productive exploration.
UX Considerations
To ensure the Skills Insight Report provided a seamless and valuable experience, we focused on four key areas:
Optimizing the report for Copilot Parsing
We structured the Skills Insight Report in a way that made it easier for Copilot to understand the hierarchy, metadata, and context of skills data. This included labeling key fields.Providing Smart Query Suggestions
We designed contextual query prompts to help new users understand what kinds of questions they could ask Copilot.Clarifying Data Scope in Responses
Attaching a file to Copilot made it more likely that responses were scoped specifically to the attached PBI file. Note that it still can hallucinate.


Next Steps
Skills Insights Dashboard
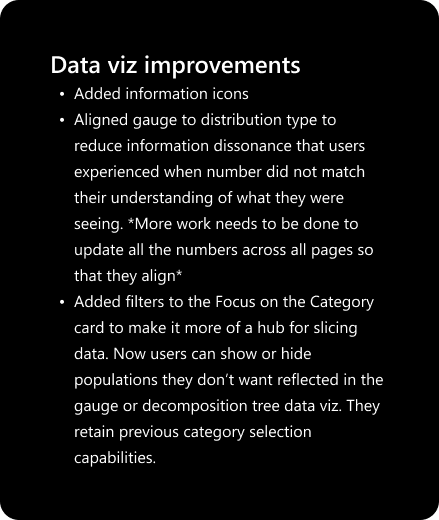
Enable direct editing of skill selections: Users would be able to add or remove specific skills directly from the distribution view, fine-tuning their analysis in real time.
Collect and analyze private preview results: We'll use upcoming feedback from private preview participants to identify friction points, gauge trust, and surface opportunities for further refinement and preparation for GA.
Copilot + Skills
One-prompt report generation: Users would be able to prompt Copilot to generate a full Skills Insight Report — visualizations, commentary, and context — with a single query.
Conclusion
This project was as much about uncovering human expectations as it was about surfacing skill data. The real challenge wasn’t building a technically sound system — it was designing for clarity, control, and confidence in an environment where AI still feels like a black box to many users.